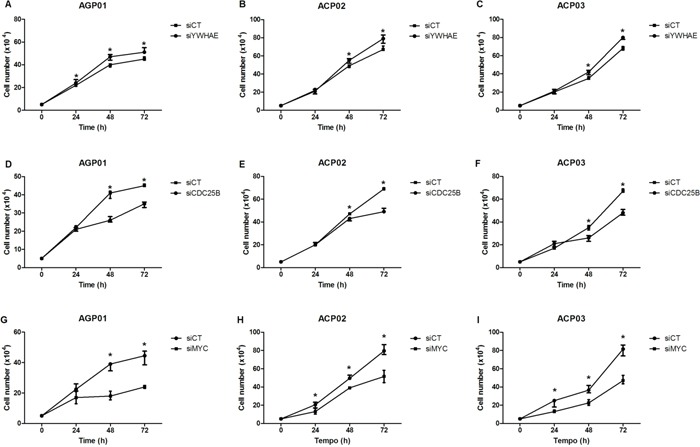
Figure 3. Effect of gene silencing in gastric cancer cell proliferation.

A. Effect of YWHAE silencing in AGP01 cell line. B. Effect of YWHAE silencing in ACP02 cell line. C. Effect of YWHAE silencing in ACP03 cell line. D. Effect of CDC25B silencing in AGP01 cell line. E. Effect of CDC25B silencing in ACP02 cell line. F. Effect of CDC25B silencing in ACP03 cell line. G. Effect of MYC silencing in AGP01 cell line. H. Effect of MYC silencing in ACP02 cell line. I. Effect of MYC silencing in ACP03 cell line. Cell counting was measured after 24, 48, and 72 h of silencing. *p<0.05, significant difference between controls and silenced cells by Mann-Whitney test. Values of median and IQR are shown. siCT: controls cells; siYWHAE: cells with YWHAE silencing; siCDC25B: cells with CDC25B silencing; siMYC: cells with MYC silencing.
