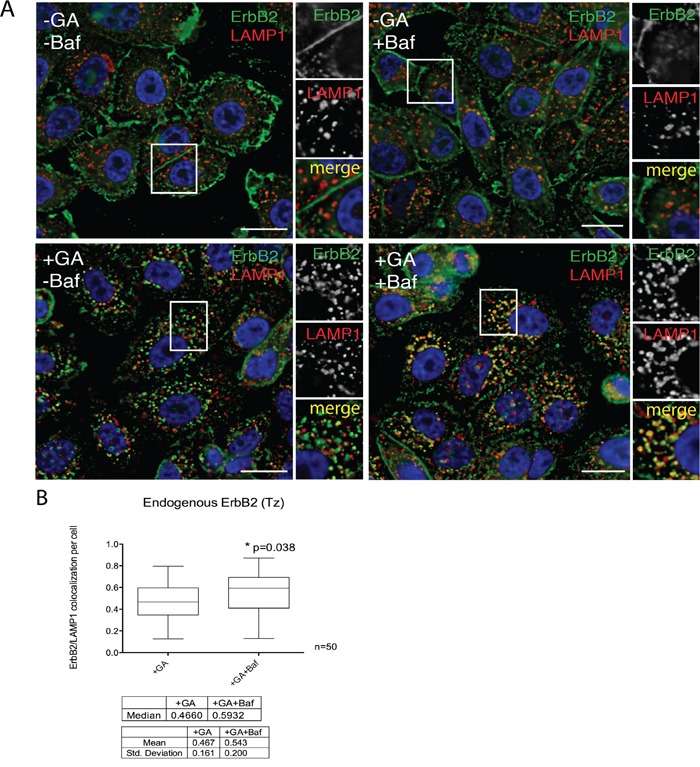
Figure 6. The N-terminal ERBB2 fragment is readily delivered to lysosomes.

A. SKBR3 cells were pre-incubated with 200nM BafilomycinA1 (Baf) for 30 minutes at 37°C and then with 20μM GA, Baf and GA+Baf for 1.5 hours at 37°C. Cells were fixed and labelled for ERBB2 (9G6, green signal) and the lysosomal marker LAMP1 (red signal). Representative confocal microscopy images are shown. Note that in the case of GA-treated cells, only few ERBB2 is found inside lysosomes, whereas the colocalization is greatly increased when Baf was added in co-treatment with GA. Insets on the right side of each image show at higher magnification the boxed area. Size bars: 10μM. B. Pixel quantification of ERBB2-LAMP1 colocalization per cell (n=3, 50 cells analyzed each experiment) in GA versus GA+Baf treated cells is depicted as box plot. The bottom and the top of each box are the first and third quartile, while the line inside the box represents the median (second quartile). The ends of the whiskers represent the minimum and the maximum data value. A significant increase (p=0.038) of ERBB2 colocalization with LAMP1 is shown when lysosomal activity was inhibited by Baf. Images and quantification are representative of three independent experiments.
