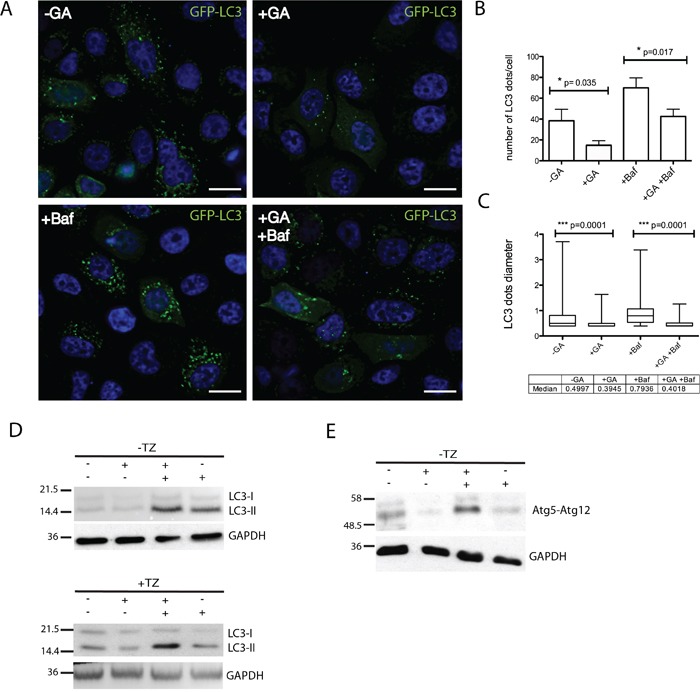
Figure 8. GA inhibits early autophagy.

A. SKBR3 transiently transfected with GFP-LC3 for 18 hours and then treated with GA, BafilomycinA1 (Baf) and GA+Baf for 2 hours at 37°C (green signal, GFP-LC3; blue signal, DAPI). Representative images are shown from two independent experiments. Scale bars: 10μM. Note that in GA-treated cells few GFP-LC3 dots are visible if compared to untreated and Baf-treated cells. B. Quantification of the average number of LC3 dots in cells (n=50) shows that GA significantly decreases LC3-positive autophagosomes (p=0.035) compared to untreated cells. Accordingly, when Baf was added to inhibit autophagosome/lysosomal fusion, GA treatment decreases the number of LC3-positive autophagosomes (p=0.017). C. Quantification of the average size of LC3 dots in SKBR3 cells (n=3, 50 cells analyzed each experiment). GA significantly decreases LC3-positive autophagosomes size (p=0.001) either alone or in co-treatment with Baf. The bottom and the top of each box are the first and third quartile, while the line inside the box represents the median (second quartile). The ends of the wiskers represent the minimum and the maximum data value. D. Autophagic flux was assessed by western blot analysis in SKBR3 cells treated with GA, Baf and GA+Baf for 2 hours at 37°C in the absence or presence of TZ. Accordingly with data presented in (A), LC3-II levels were decreased in the presence of GA. The level of LC3-II is increased in the presence of the lysosomal inhibitor Baf because the transit of LC3-II through the autophagic pathway is blocked, but is decreased in GA+Baf treated cells, indicating inhibition of early autophagy. TZ does not influence the inhibition of autophagy mediated by GA. E. Protein levels of the early autophagy marker atg5-atg12 complex is assessed by western blot analysis in SKBR3 cells treated with GA, Baf and GA+Baf for 2 hours at 37°C. It is shown that GA reduces the level of this complex. GAPDH was used as loading control for all the experiments. On the left side of each panel the migration of protein molecular mass standards expressed in kDa is shown.
