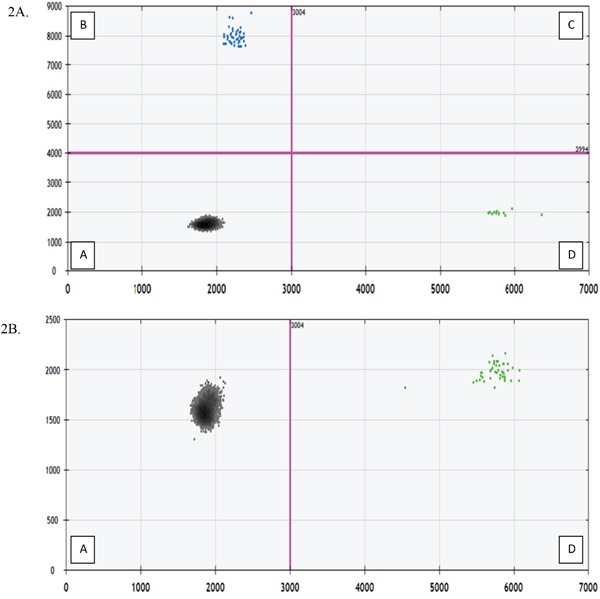
Figure 2. Fluorescent Amplitude Plot (X-axis: HEX flourescent wild type droplet; Y-axis: FAM fluorescent mutation droplet).

Quadrant A contains the droplets with no cfDNA alleles corresponding to wild type or BRAF probe. Quadrant B contains droplets with BRAF mutated cfDNA. Quadrant C contains droplets with both wild type and mutant alleles. Quadrant D contains droplets with BRAF wild type cfDNA. Figure 2A. Patient #6 with detectable mutated BRAF cfDNA in CSF. Figure 2B. Patient #4 with undetectable mutated BRAF cfDNA in CSF.
