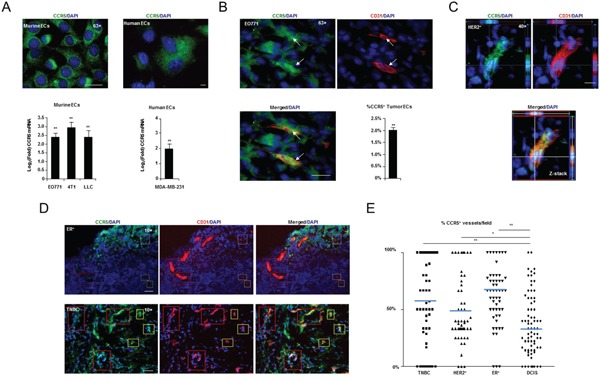
Figure 4. CCR5 expressing vasculature and pathology.

A. Upper, High resolution (63×) fluorescent microscopy showing CCR5 expression in murine (MHEVC) and human (HUVEC) endothelial cells (ECs) in vitro. Scale bar, 20 μm. Lower, Q-PCR showing significant induction of CCR5 mRNA in murine and human ECs, in response to murine (EO771, 4T1 & LLC) and human (MDA-MB-231) tumor conditioned medium, respectively. Data is represented as mean Log2(Fold) ± S.E.M. (n = 5 per group). B. High resolution (63×) fluorescent microscopy showing that CD31+ endothelial cells (ECs) express CCR5+ in EO771 tumors in situ (arrows). Lower Right, Results of FACS analysis showing the percentage of CD31+ CD11b- ECs that are CCR5+ in EO771 tumors. Data is represented as a mean percentage of the total number of tumor ECs ± S.E.M. C. High resolution (40×) fluorescent microscopy Z-stack showing that CD31+ vasculature in human HER2+ breast cancers express CCR5. Scale bar, 10 μm. D. Fluorescent microscopy showing estrogen receptor (ER)+ (Upper) and triple negative (TNBC) (Lower) tumors, with CCR5 positive and negative vessels (red boxes) and ECs (yellow boxes). Scale bar, 50μm. E. Scoring analysis of CCR5 expression in CD31+ vasculature from TNBC, HER2+, ER+ and DCIS human breast cancers. Dot plot showing a significantly higher number of CCR5+ CD31+ tumor blood vessels in TNBC, HER2+ and ER+ tumors compared with DCIS. At least 10 fields were analyzed per section. For A, B & E, data was analyzed by Unpaired t test (‘*’P < 0.05, ‘**’P < 0.01; α = 0.05).
