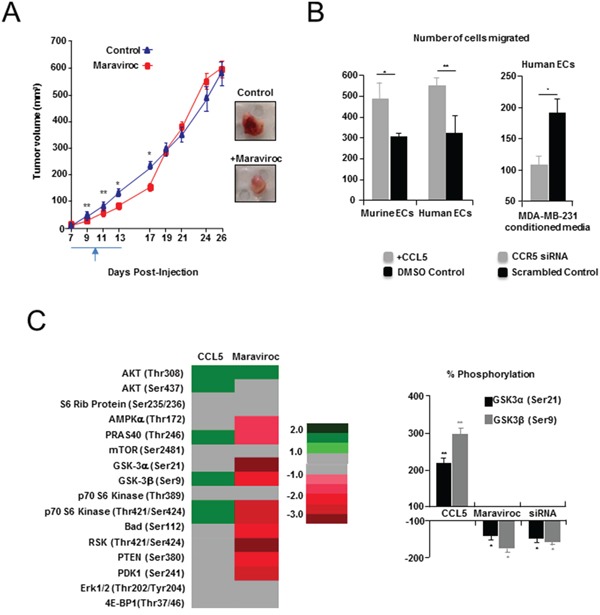
Figure 5. Pharmacologic inhibition of CCL5/CCR5 in a syngeneic model of breast cancer.

A. Left, delayed tumor growth, following maraviroc administration, compared with controls. Treatment commenced on day seven, and was followed by twice daily oral administration (gavage) of 10 mg/kg (3 % DMSO) maraviroc. Controls received vehicle only. Right, Tumors resected from maraviroc-treated animals (Day 13) were also paler. Scale bar, 10 mm. B. Left, Transwell assays showing significant number of mouse (MHEVS) and human (HUVEC) endothelial cells (ECs) migrated towards CCL5, compared to BSA control. Also shown (Right), a significant decrease in migration of human ECs in response to conditioned media from MDA-MB-231 breast cancer cells following siRNA suppression of CCR5, compared with scrambled siRNA control. Data is represented as mean number of migrated cells ± S.E.M. C. Left, Heat map of Pathscan AKT pathway analysis showing fold change in phosphorylation status of several members of the pathway in murine ECs, following treatment with CCL5 or suppression of CCR5 with maraviroc. Fold is determined by mean difference in average pixel density, between treated and control spots, following normalization. Right, Change in phosphorylation of GSK-3α (Ser21) and GSK-3β (Ser9) following treatment with CCL5, CCR5 siRNA or maraviroc, was confirmed by western blot analysis, and determined following normalisation against total GSK-3 protein. Tubulin was used as a loading reference. Data represented as mean % change in phosphorylation ± S.E.M. For B & C, data was analyzed by Unpaired t test (‘*’P < 0.05).
