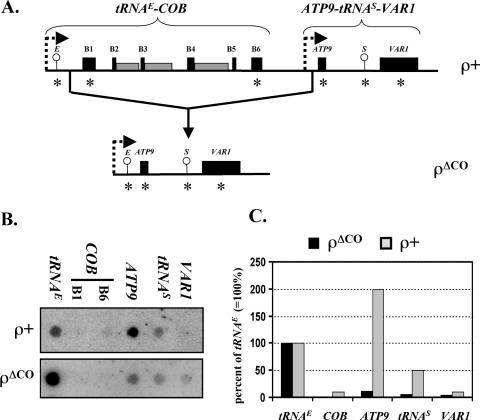
Figure 3.
Run-on transcription analysis of the ρΔCO mutant. (A) Schematic depiction of a portion of the mitochondrial genome from wild-type yeast including the tRNAE-COB and ATP9-tRNAS-VAR1 transcription units (top) and the corresponding region of the ρΔCO mitochondrial genome (bottom). Circles indicate the location of tRNA genes, black boxes represent coding sequences while gray boxes represent introns. Promoters are symbolized by broken rightward arrows. The relative positions of the oligonucleotides used for dot-blot analysis as shown in (B) are indicated by asterisks. (B) Dot-blot analysis of run-on transcripts. The gene-specific oligonucleotides indicated in (A) were dotted onto a nylon filter and hybridized with 32P-labeled run-on transcripts from S150-2B (ρ+) and ρΔCO mitochondria (see Table 1). (C) Hybridization intensities of COB, ATP9, tRNAS and VAR1 in relation to tRNAE. Densitometric values of the hybridization signals were determined using a PhosphorImager (see Materials and Methods). The values obtained for tRNAE were set to 100% and used as a reference for the downstream genes.

