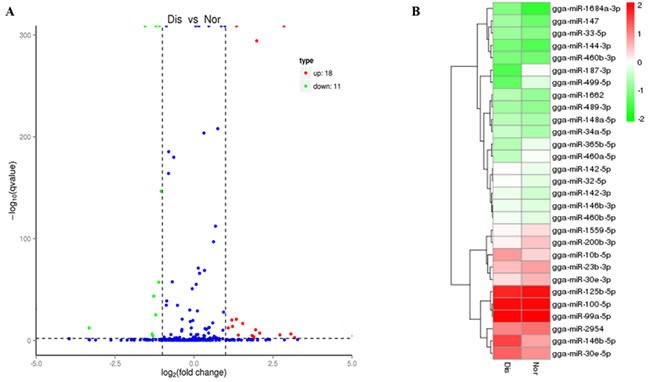
Figure 2.

A. Volcano diagram displaying differentially expressed miRNAs between the Dis and Nor samples. The remarkably up-regulated miRNAs are shown in red, and down-regulated miRNAs are shown in green, whereas no difference is marked in blue with respect to the threshold of qvalue < 0.01 and |log2 (fold change) | > 1. B. Analysis of miRNAs expression clustering of Nor and Dis sample. Red indicates the high expression levels, blue indicates low expression.
