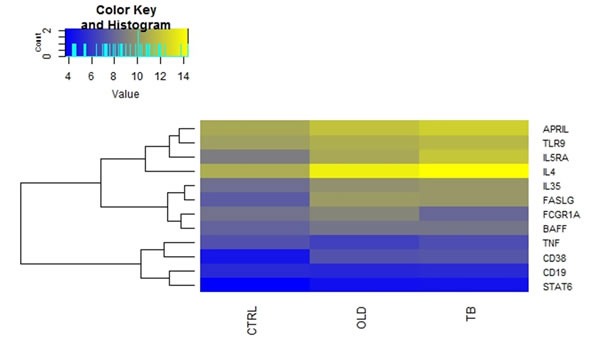
Figure 1. Differences in mRNA expression between TB and Control groups.

Comparison of the average gene expression between the respective groups. Where Ctrl are healthy controls, OLD are individuals with other lung diseases and TB are individuals is TB disease. Heatmap, which was generated using R statistical packages, depicting changes in normalized expression values (dCt). Genes with low expression levels are depicted in yellow, whereas genes with high expression levels are depicted in blue.
