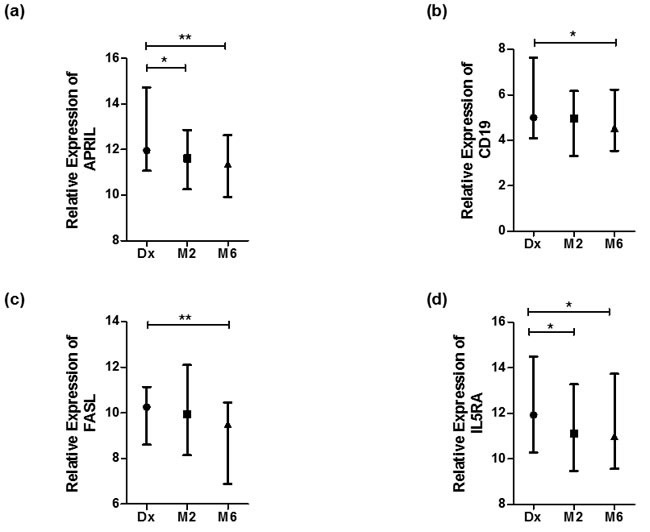
Figure 3. Genes differentially expressed during anti-TB treatment.

Normalized expression values of genes as calculated using the dCt method (Ct (gene) - Ct (housekeeping gene)). Statistical differences calculated by means of Kruskal Wallis tests, where significant differences are indicated by an asterisk (* = p < 0, 05 or ** = p < 0.01). Data represented as median dCt with bars representing range. High dCt values indicate low gene expression, and low dCt values indicate high gene expression. a. APRIL, b. CD19, c. FASL and d. IL5RA.
