
Figure 3. The FcγRIIA and FcγRIIB mRNA expression ratio of KD patients with (N = 7) and without CAL (N = 37) and the control subjects (N = 10) was determined using quantitative PCR.
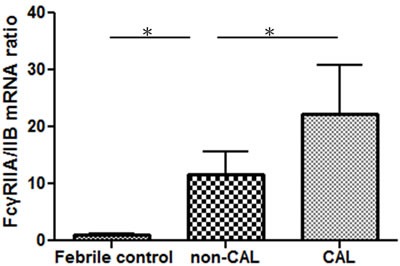
*p-value < 0.05.
Official websites use .gov
A
.gov website belongs to an official
government organization in the United States.
Secure .gov websites use HTTPS
A lock (
) or https:// means you've safely
connected to the .gov website. Share sensitive
information only on official, secure websites.
*p-value < 0.05.