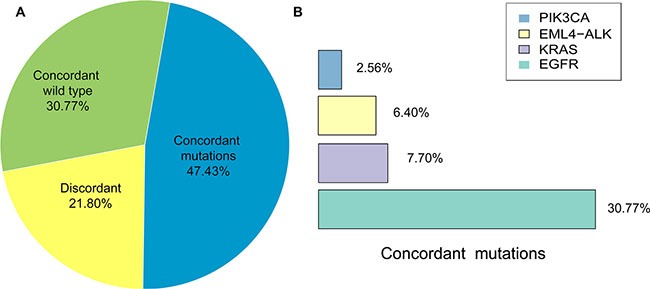
Figure 2. Comparison of matched tissue and plasma mutations.

(A) Percentage of concordant (wild type and mutations) and discordant mutations in matched tissue and plasma samples. (B) Percentage of NSCLC-related driver gene mutations detected in both matched tissue and plasma samples.
