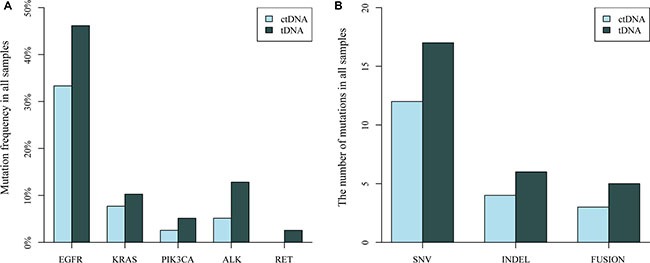
Figure 4. Comparison of the distribution of driver gene mutations identified in NSCLC tissue DNA (tDNA) and plasma DNA (ctDNA) samples.

(A) Mutation frequency of EGFR, KRAS, PIK3CA, ALK and RET in 39 sample pairs. (B) The number of mutation types (SNV, INDEL and gene fusion) detected in 39 paired samples.
