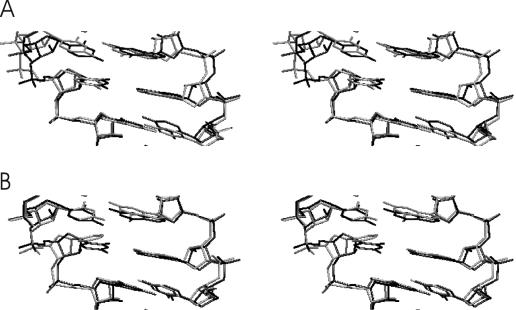
Figure 4.
Superposition of the average structures (central and neighbouring base pairs) obtained during the data gathering period of the reference RNA simulation (black line) and the simulation on the RNA with central F:A base pair (grey line in A) and the central P:A base pair (grey line in B), respectively. The view is into the major groove.

