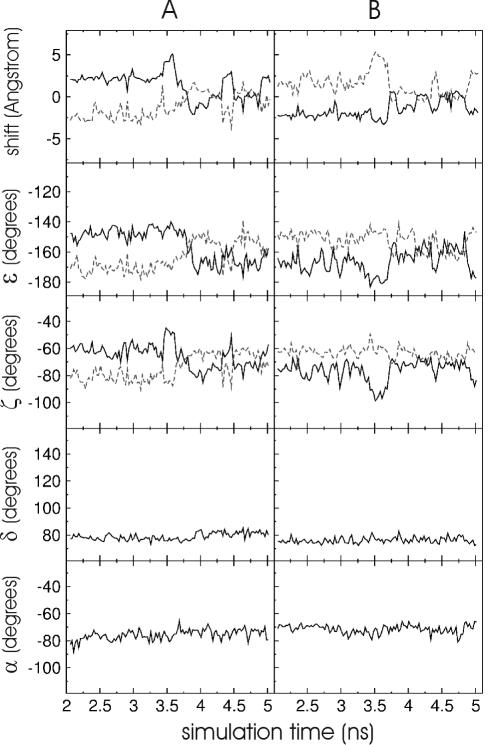
Figure 7.
Shift motion (motion in the base pair plane perpendicular to the direction that connects two bases on opposite strands) of the difluorophenyl-base analogue with respect to the 3′-flanking (black line) and the 5′-flanking base (grey line) in the rCGUFACG/5′-rCGUAACG duplex versus simulation time. For comparison, the changes in the backbone torsion angles ɛ and ζ at the central bases (black line) and at the 5′-flanking bases (grey dashed line) are shown, respectively. In addition, the changes of dihedral angles δ (fourth panel) and α (fifth panel) at the central base versus simulation time are indicated. The panel series (B) shows the same as in (A) but for the adenine nucleotide in the opposite strand. Each data point represents an average over 25 ps simulation time.

