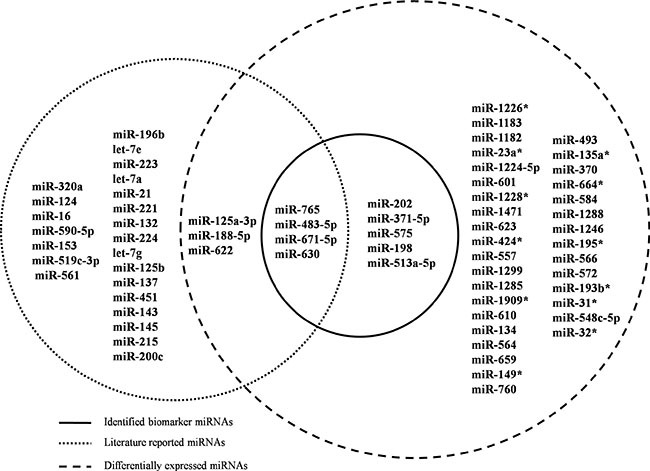
Figure 3. Venn diagram for literature-reported chemoradiotherapy associated miRNAs, DE miRNAs and identified miRNA biomarkers.

Dashed circles on the left and right represent literature-reported miRNAs and DE miRNAs, respectively. Nine miRNAs in the solid circle are candidate biomarkers identified by POMA model. Abbreviations: DE: differentially expressed; POMA: Pipeline of Outlier MicroRNA Analysis.
