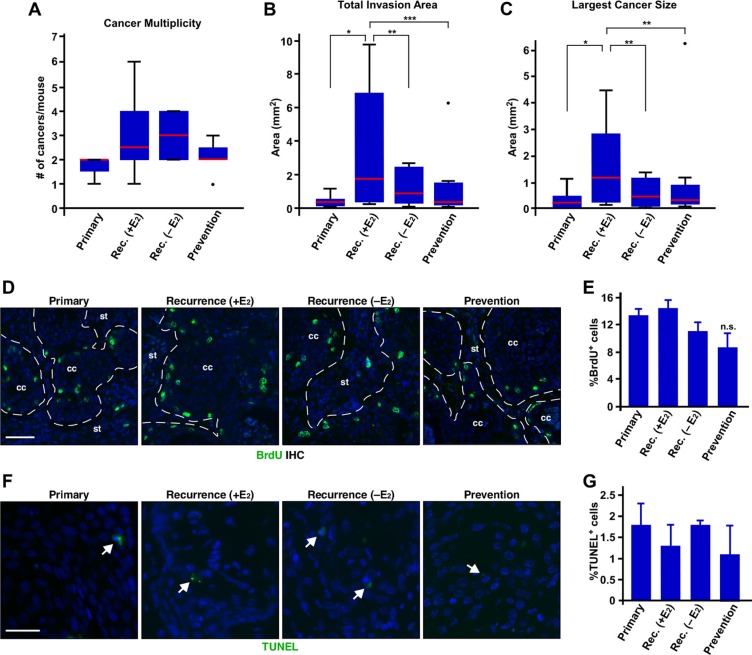
Figure 2. Exogenous E2 results in larger recurrent cervical cancer without affecting proliferation and apoptosis.
(A) Exogenous E2 does not increase the number of recurrent cervical cancer. The number of cancer in each mouse is shown as box plot. Red lines show the medians and box limits indicate the 25th and 75th percentiles. Whiskers extend 1.5 times the interquartile range. A dot indicates outlier. Group sizes are indicated in Table 1. Rec., recurrence. (B) Exogenous E2 increases total invasion area. Total invasion area per mouse is shown as box plot as described in A. Group sizes are indicated in Table 1. *P = 0.01, **P = 0.05, ***P = 0.03. (C) Exogenous E2 induces larger recurrent cervical cancer. The size of largest cancer per mouse is shown as box plot as described in A. Group sizes are indicated in Table 1. *P = 0.02, **P = 0.05. (D) Exogenous E2 or MPA does not affect proliferation of recurring cervical cancer cells. Cervical cancer sections were stained for BrdU (green) to measure cell proliferation. Nuclei are shown in blue. Dotted lines separate cervical cancer (cc) from stroma (st). Scale bar, 50 μm. (E) Results shown in D. was quantified and shown as mean ± S.E.M. (n = 3). (F) Exogenous E2 or MPA does not influence apoptosis of recurrent cervical cancer. Cervical cancer sections were subjected to TUNEL assay. TUNEL+ cells are shown in green (see white arrows). Nuclei are shown in blue. Scale bar, 30 μm. (G) Results shown in F. was quantified and shown as mean ± S.E.M. (n = 3).

