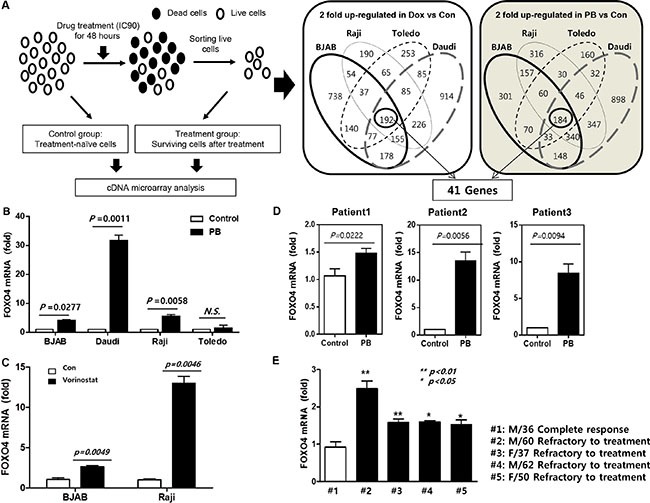
Figure 3. Comparison of gene expression profiles and FOXO4 overexpression.

(A) Study scheme of gene expression analyses using doxorubicin (Dox) and phenylbutyrate (PB)-treated surviving cells: Four different cell lines (BJAB, Raji, Toledo, and Daudi) are treated with doxorubicin (300 nM) or phenylbutyrate (8 mM) for 48 h, and cDNA microarray analysis is done to identify differentially expressed target genes between treatment-surviving cells and parental control cells. (B) FOXO4 mRNA level is significantly higher in phenylbutyrate-treated surviving (PB) cells of BJAB, Raji and Daudi than control cells. (C) Vorinostat-treated surviving cells show higher mRNA level of FOXO4 than control (Con) cells of BJAB and Raji. (D) Primary lymphoma cells from three patients with refractory diffuse large B-cell lymphoma (DLBCL) show increased expression of FOXO4 in phenylbutyrate-treated surviving cells (PB) compared to the corresponding control cells. (E) The FOXO4 mRNA level is significantly higher in primary cells from four patients with refractory DLBCL than that of a patient with DLBCL who achieved complete response. Data represent means ± SD from three independent experiments.
