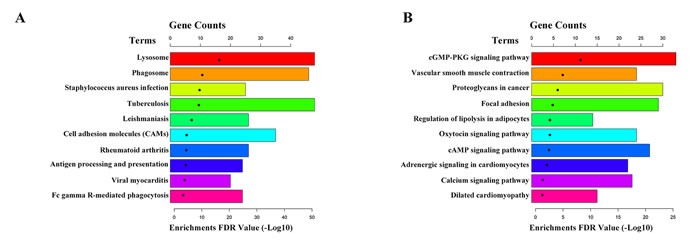
Figure 4. KEGG pathway analysis of differentially expressed mRNAs.

A. The top 10 pathways up-regulated in IAs compared with STAs. B. The top 10 pathways down-regulated in IAs compared with STAs.

A. The top 10 pathways up-regulated in IAs compared with STAs. B. The top 10 pathways down-regulated in IAs compared with STAs.