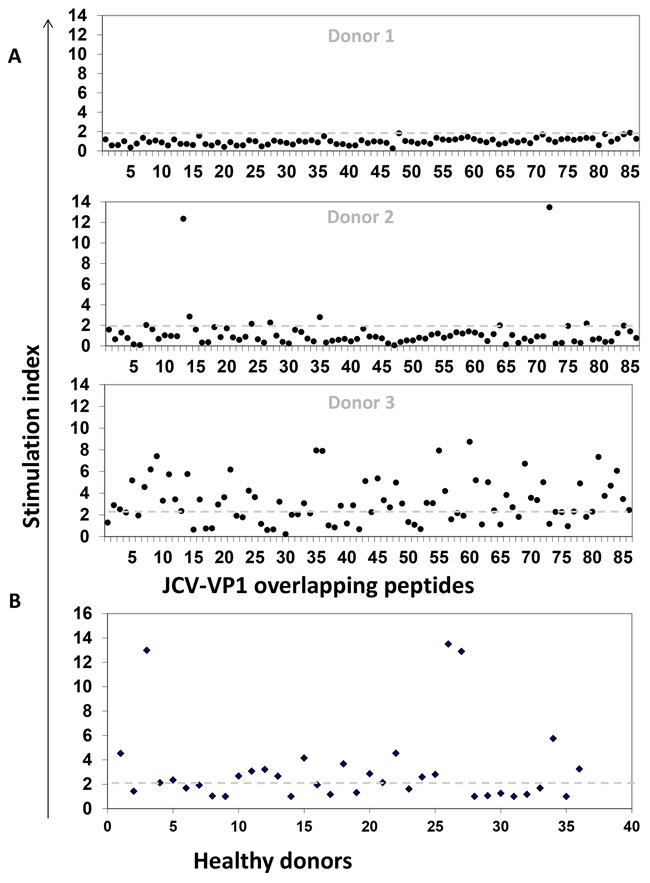
Figure 1. JCV-specific T cell responses of healthy donors.

In order to expand CD8+ T cells, MLPC assays were performed with magnetically sorted CD8+ T cells as responder and irradiated CD8- PBMCs or T2 cells as stimulators. Antigen-specific responses were characterized by a stimulation index (S.I.). S. I. representing the ratio of the number of IFN-γ secreting cells after antigen stimulation to that without stimulation (negative control) in ELISPOT assays. Responses were considered as positive when the S.I. was equal or above the cut-off of two (dashed grey line). A. Dot-plots showing the breadth of JCV-specific T cell responses represented by three healthy donors (Donor 1, 2 and 3). Cells were stimulated with 86 individual overlapping peptides derived from VP1 protein of JCV. B. Dot-plot showing production of IFN-γ in 36 HLA-A*02 positive healthy donors after stimulating with VP1 peptide pool (overlapping 1 to 86 peptides in one pool). 16 donors out of 36 exhibit positive T cell responses.
