
Figure 3. Migration of TNBC cells.
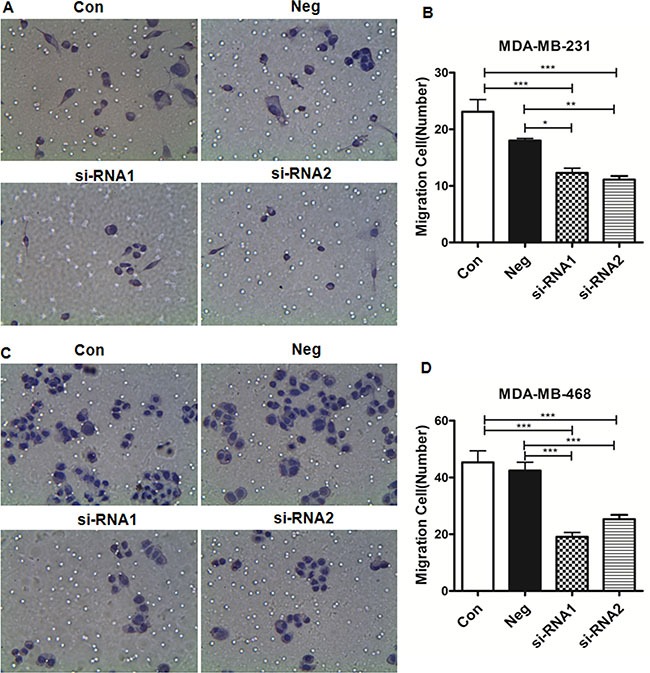
Light microscopic examination shows the migration of MDA-MB-231 (A) and MDA-MB-468 (C) cells; the relative migration rate of MDA-MB-231 (B) and MDA-MB-468 (D). Cells that migrated through the membrane were counted in five random fields for each group, and the relative migration rate= number of migrated cells/number of migrated cells in the control group).*P < 0.05; **P < 0.001; ***P < 0.0001. (Con = non-transfected cells; Neg = cells transfected with control shRNA lentiviral vector).