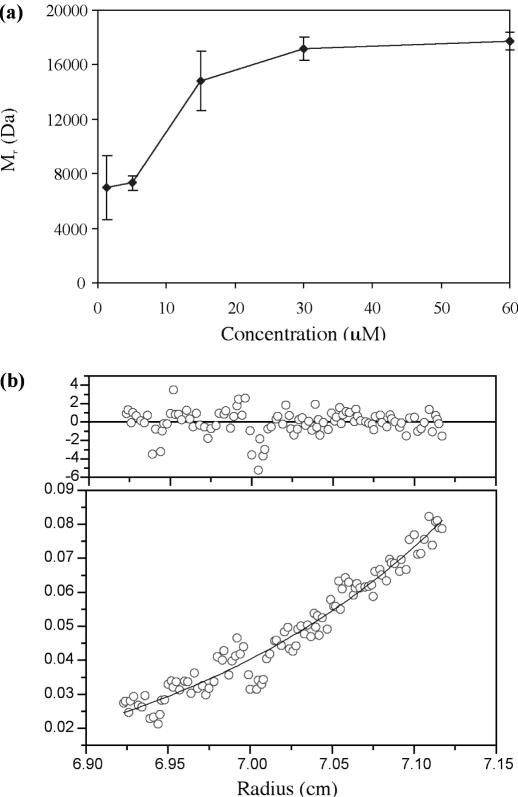
Figure 4.
Sedimentation equilibrium. (a) Weight-averaged Mr from sedimentation equilibrium runs for C.AhdI at a series of different concentrations, with associated errors from the fit. (b) The sedimentation equilibrium profile at 15 μM protein was fitted to a monomer–dimer equilibrium model, and residuals shown (× 10−3). The centrifuge was run at 21 000 r.p.m. for 13 h (20°C) and absorption monitored at 235 nm.

