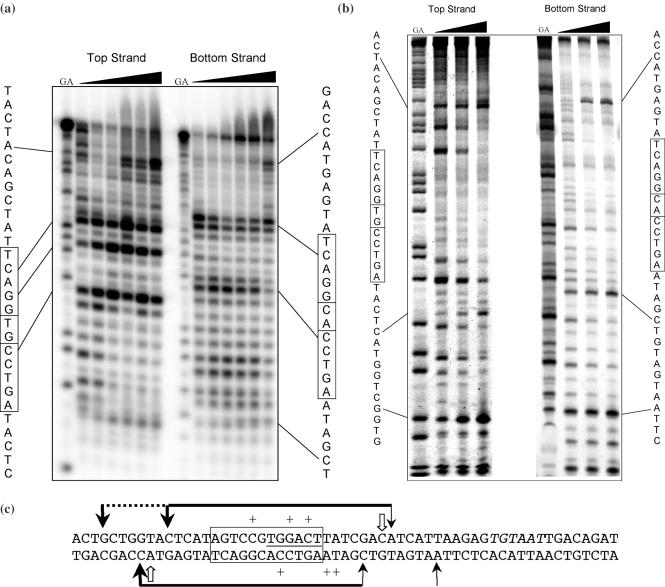
Figure 5.
DNA footprinting of C.AhdI. (a) Exonuclease III footprinting. Cleavage sites are shown for the 5′-labelled top and bottom strands of the 35 bp DNA duplex (1 μM). The G + A ladder is shown to the left of each series, and concentration dependent cutting sites are indicated. The protein concentration range was 0–8 μM. (b) DNase I footprinting of C.AhdI. Cleavage sites are shown for the 5′-labelled top and bottom strands of the 60 bp DNA duplex (4 μM). The G + A ladder is shown to the left of each series, and concentration dependent cutting sites are indicated. The protein concentration range was 0–16 μM. (c) Summary of footprinting data. The sites of enhanced cutting by DNase I are shown as black arrows. The horizontal black bar shows the major regions of DNase I protection, along with secondary regions of protection (dotted line), thicker lines/arrows representing more prominent protection/enhancement. The principal ExoIII stop sites are indicated by open arrows, but there is a major additional stop site near the centre of the footprint which is prominent at intermediate protein concentrations (smaller arrow). The central 12 bp sequence which includes the symmetrical sequence is boxed. The putative −35 box sequence, TTGACT, is underlined and the −10 site, TGTAAT, italicized.

