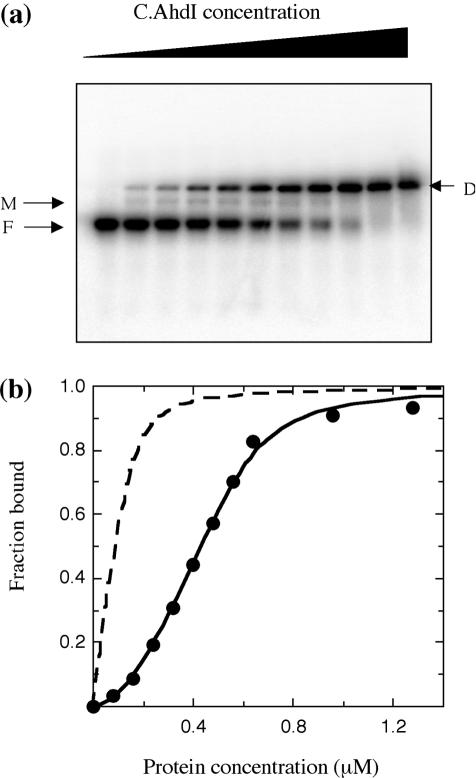
Figure 6.
Electrophoretic mobility shift assay. (a) Protein samples of increasing concentration (0–1280 nM) were incubated with 80 nM DNA. The monomer (M) and dimer complexes (D) are indicated, together with the free DNA band (F). (b) The fraction bound was determined using ImageQuant software and the value plotted was the average of values obtained from two gels. The solid line shows the fitted curve for a monomer–dimer equilibrium model (see text) with K1 = 2.5 μM and K2 = 6.4 nM. For comparison, the dotted line shows the theoretical binding curve in the absence of dimer dissociation (K1 = 0 and K2 = 6.4 nM).

