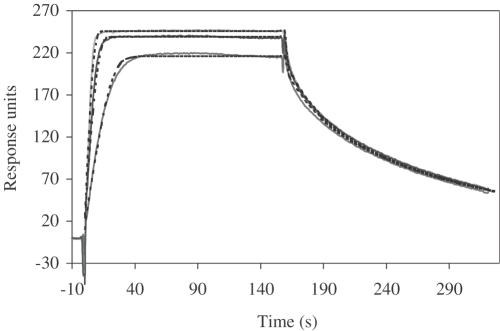
Figure 7.
Surface plasmon resonance. C.AhdI samples of varying concentration (100, 200 and 300 nM) were injected at 30 μl min−1 and the binding curves were fitted to a 1:1 Langmuir binding model with mass transfer (dotted lines). A protein–DNA dissociation constant of 4.8 nM was calculated from the on-rate (4.8 × 10⁶ M−1 s−1) and off-rate (0.023 s−1).

