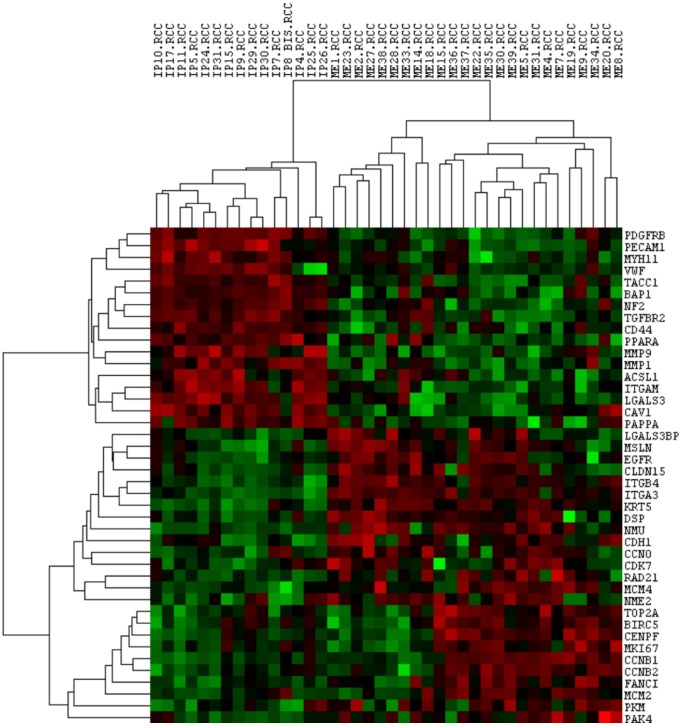
Figure 2. Unsupervised cluster analysis of statistically deregulated genes and all samples.
Each column represents a single sample and each row a single gene. IP: reactive mesothelial hyperplasia (MH); ME: Epithelioid mesothelioma (MPM); .RCC: file extension. Red indicates a high level of expression relative to the mean expression, and green indicates a low level of expression relative to the mean expression.

