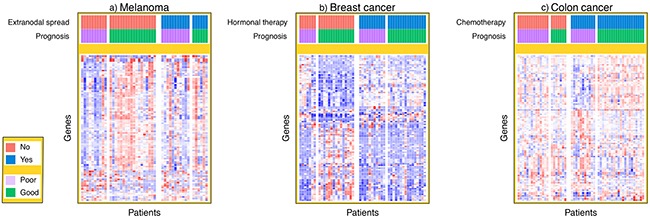
Figure 3. Heat maps of gene expression signal.

The standardized gene expression signal is plotted for the top 100 genes with largest fold change for each patient in the melanoma, breast cancer and colon cancer cohorts. In the heat map, each row represents a different gene and each column represents a different patient sample. The patients from each dataset have been ordered by both prognosis and either extranodal spread, hormonal therapy or chemotherapy in the melanoma, breast cancer and colon cancer cohorts respectively.
