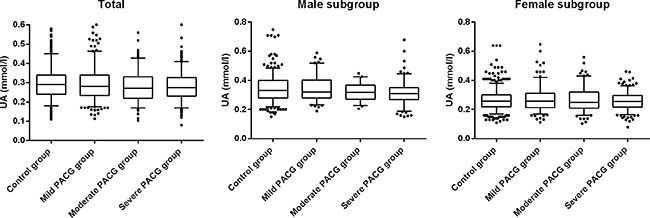
Figure 1. Comparison of serum levels of uric acid (UA) in patients with mild, moderate, severe PACG and control group: using box-and-whisker plot.

The box contained 50% of all values (from 25th to 75th percentile) and was divided by the horizontal bar of the median value (50th percentile). The whiskers showed the remainder of the distribution (1.5 × Inter Quartile Range). Outliers were shown as dots.
