
Figure 3. Combination of Met and Prop shows anti-mitochondrial properties and stimulates glycolysis.
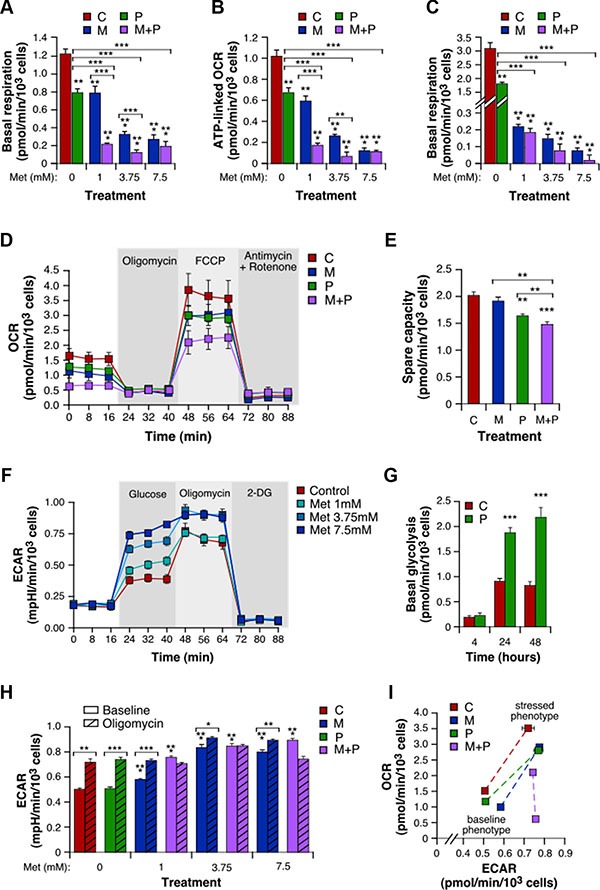
4T1 cells treated with Prop (10 μM) and Met (1, 3.75 and 7.5 mM) alone or in combination for 4 h were analyzed for mitochondrial bioenergetics using the Seahorse XF technology. Measurement of basal level of oxygen consumption rate (OCR) was followed by sequential injections of FCCP and rotenone/antimycin A to allow determination of the amount of non-ATP-linked oxygen consumption (proton leak), the maximal respiration and the non-mitochondrial oxygen consumption. (A) Basal respiration, calculated as the difference between basal OCR and non-mitochondrial OCR. (B) ATP-linked OCR, defined as the difference between basal OCR and non-ATP-linked oxygen consumption. (C) Basal respiration of 4T1 cells exposed to Met and Prop for 24 h. (D) Real-time mitochondrial bioenergetic profile of live 4T1 cells after a 4 h-treatment with Prop 10 μM, Met 1 mM, and the combination. (E) Spare capacity, defined as the difference between basal and maximal rates. (F) Real-time measure of extracellular acidification rate (ECAR) was performed in intact 4T1 cell cultures first incubated in assay medium without glucose and pyruvate, and then successively supplemented with glucose, with the ATP synthase inhibitor oligomycin that consequently accelerate the glycolytic process, and with the glycolysis inhibitor 2-deoxy-glucose (2-DG). (G) Basal glycolysis, calculated as the difference between glucose-mediated ECAR and rates without glucose, in 4T1 cells treated with vehicle or Prop 10 μM for the indicated times. (H) Basal and oligomycin-stimulated ECAR in cells incubated for 4 h with a range of concentrations of drugs alone or combined. (I) Energy phenotype of 4T1 cells after a 4 h-treatment with Prop and/or Met. Mitochondrial respiration and glycolysis were first simultaneously analyzed under the starting medium conditions (Baseline Phenotype) and then upon injection of FCCP and oligomycin, respectively (Stressed Phenotype). The metabolic potential (dotted lines) revealed 4T1 cells ability to meet an energy demand, and preferred pathway. (M: Met, P: Prop, M + P: Met + Prop; n = 3).