Figure 1.

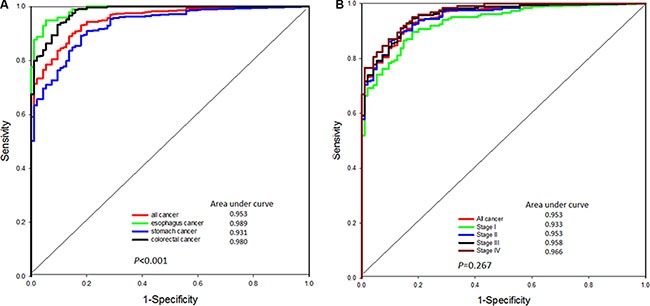
(A) The ROC curve of cfDNA levels in healthy individuals and patients with different types of GI tract cancer. (B) The ROC curve of cfDNA levels in healthy individuals and patients with different stages of GI tract cancer.

(A) The ROC curve of cfDNA levels in healthy individuals and patients with different types of GI tract cancer. (B) The ROC curve of cfDNA levels in healthy individuals and patients with different stages of GI tract cancer.