
Figure 1. The results of capture efficiency tests.
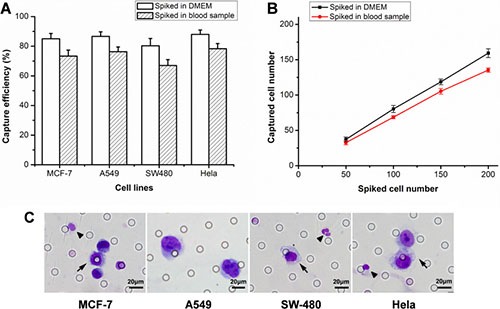
(A) The capture efficiencies of different tumor cells sipked into DMEM or blood samples. (B) Captured SW480 cell number against the number of spiked in DMEM or blood samples at different concentrations. The error bars represent a mean ± standard deviation from three repeats. (C) Wright's staining of captured MCF-7, A549, SW480 and Hela cells. The arrows indicated tumor cells and the triangle (▲) indicated white blood cells (WBCs).