
Figure 1. Effects of SAHA or/and MG132 on the proliferation and cellular energy metabolism of glioma cells.
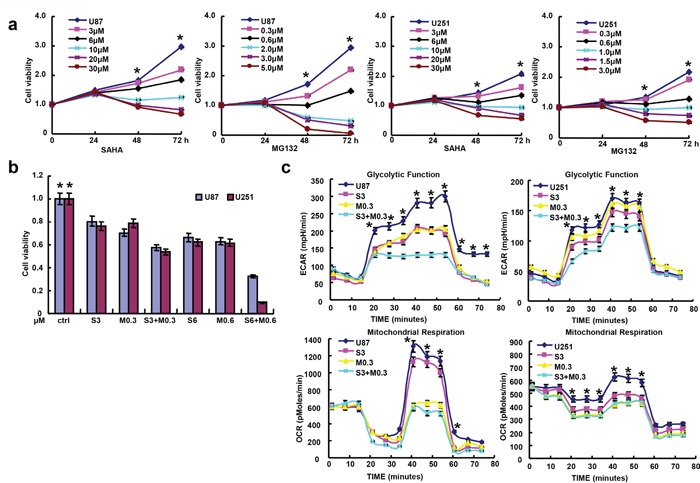
MTT assays showed that SAHA or MG132 treatment suppressed the proliferation of U87 and U251 cells in either a concentration- or time-dependent manner a. with an additive effect b. Cellular energy metabolism assay was performed after cells were treated with both drugs for 48 h c. Results are representative of 3 different experiments, and the data is expressed as mean ±standard deviation with the control as “1”. Note: S3, SAHA 3 μM; M0.3, MG132 0.3 μM; S6, SAHA 6 μM; M0.6, MG132 0.6 μM; S3 + M0.3, SAHA 3 μM and MG132 0.3 μM; S6 + M0.6, SAHA 6 μM and MG132 0.6 μM. *p< 0.05, vs treatment groups.