
Figure 4. The mRNA and protein expression of gliomas cells treated with SAHA or/and MG132.
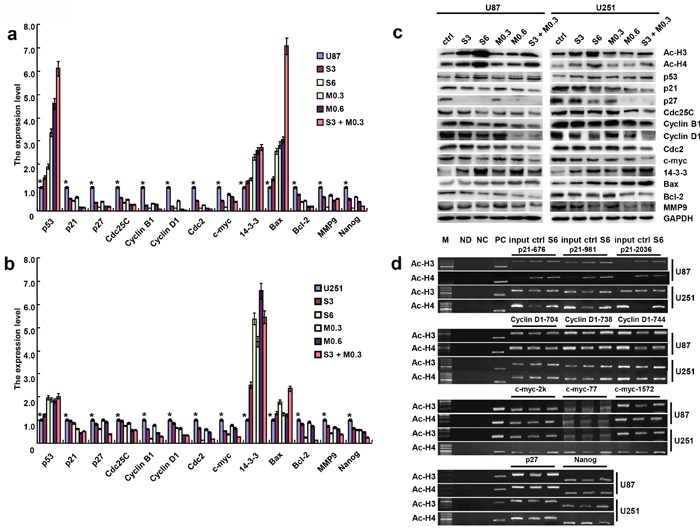
After the treatment with SAHA or/and MG132, the expression levels of phenotype- related molecules were screened in U87 and U251 cells by real-time RT-PCR a, b. and Western blot c. The promoter binding sites of acetylation-histone 3 and 4 were determined by ChIP; M: DNA marker; ND: No DNA control; NC: Negative control; PC: Positive control d. Results are representative of 3 different experiments, and the data are expressed as mean ±standard deviation with the control as “1”. Note: S3, SAHA 3 μM; M0.3, MG132 0.3 μM; S6, SAHA 6 μM; M0.6, MG132 0.6 μM; S3 + M0.3, SAHA 3 μM and MG132 0.3 μM. *p < 0.05, vs treatment groups.