
Figure 6. SAHA or/and MG132 suppressed the growth of glioma cells in vivo.
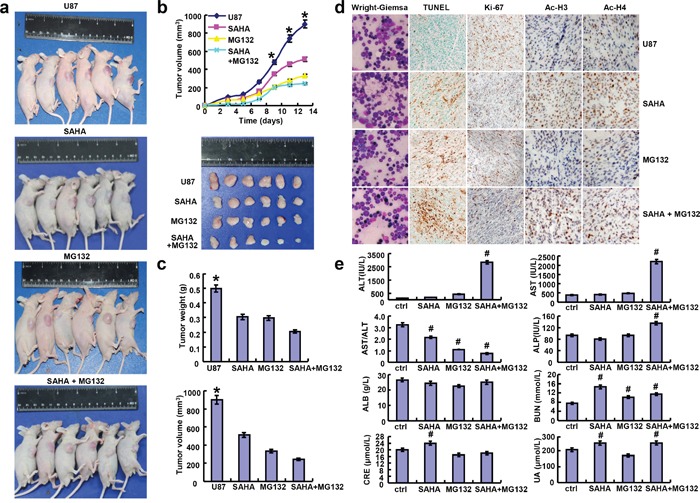
After the exposure to SAHA and/ or MG132, the growth of U87 cells was revealed by measurement of tumor size a. and growth curve b. volumeand weight c. Wright-Giemsa staining was used to observe the morphological appearance of bone marrow. Stronger acetyl-histones 3 and 4 staining was observed in SAHA group than the control d. Either weaker ki-67 or stronger TUNEL staining was seen in SAHA or/and MG132 group than the control (d). The serum levels of ALT, AST, ALP, ALB, BUN, CRE and UA were measured by automatic biochemical analyzer e. Note: SAHA, 20 mg/kg; MG132, 2 mg/kg; SAHA+MG132, SAHA 20 mg/kg and MG132 2 mg/kg. *p< 0.05, vs treatment groups; #p < 0.05, vs control group.