
Figure 4. Results of DEGs by metaDE.
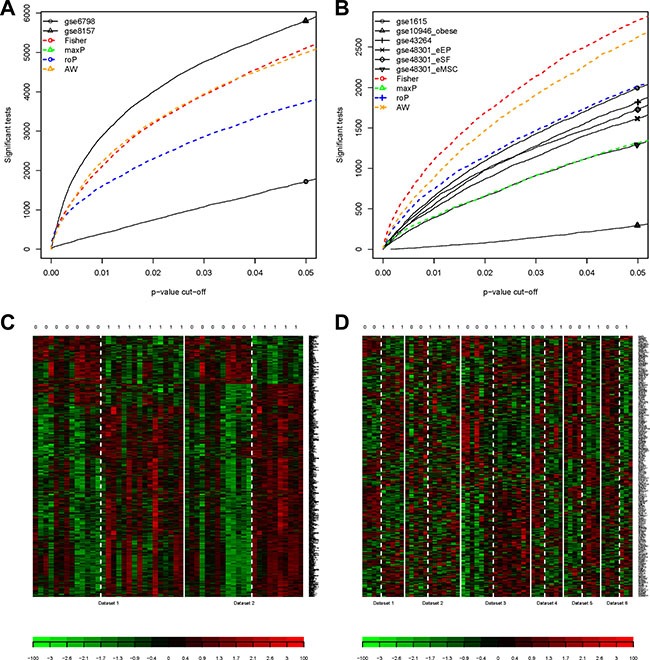
(A) The detection competency curves for Muscle2; (B) The detection competency curves for PCOS6; (C) The heatmap plot of DEG expression profiles for Muscle2; (D) The heatmap plot of DEG expression profiles for PCOS6. The column with 0 on top stands for normal samples, while 1 stands for PCOS patients.