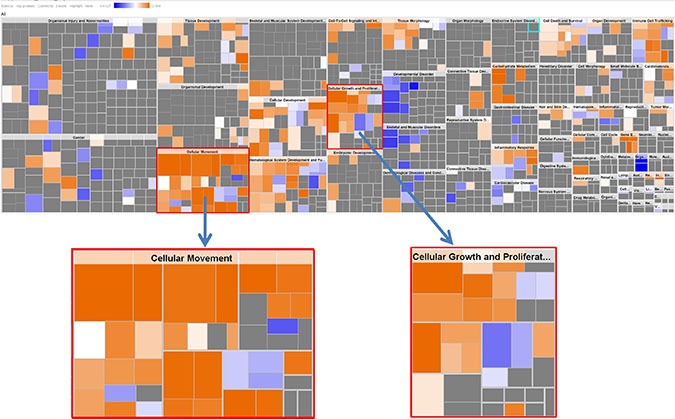
Figure 1. IPA Downstream Effects Analysis: Biological activities associated with the CRC KRAS-MT gene signature.

Each individual square is a particular biological function or process. Orange squares indicate increases and blue squares decreases in the functions. A gray square means no predicted change in that particular function. In this figure, cellular movement and cellular growth/proliferation are prominently shown to have increased activities.
