
Figure 2. IPA Network Analysis using the KRAS-MT gene signature.
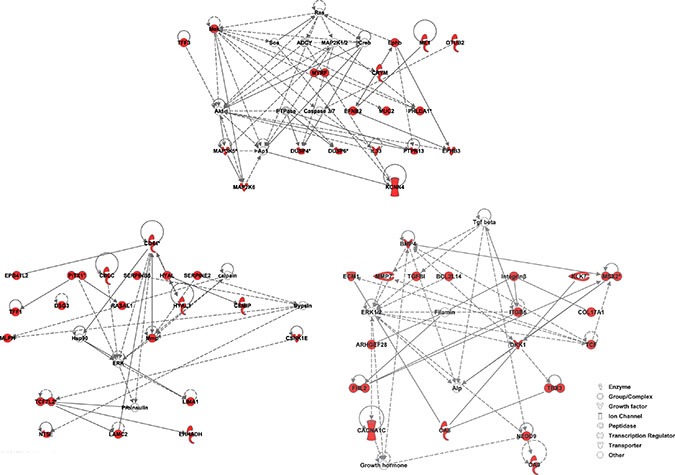
We observe that the MAPK/ERK pathway is highlighted in the 3 highest scoring networks. Members of the gene signature are highlighted in red.
Official websites use .gov
A
.gov website belongs to an official
government organization in the United States.
Secure .gov websites use HTTPS
A lock (
) or https:// means you've safely
connected to the .gov website. Share sensitive
information only on official, secure websites.
We observe that the MAPK/ERK pathway is highlighted in the 3 highest scoring networks. Members of the gene signature are highlighted in red.