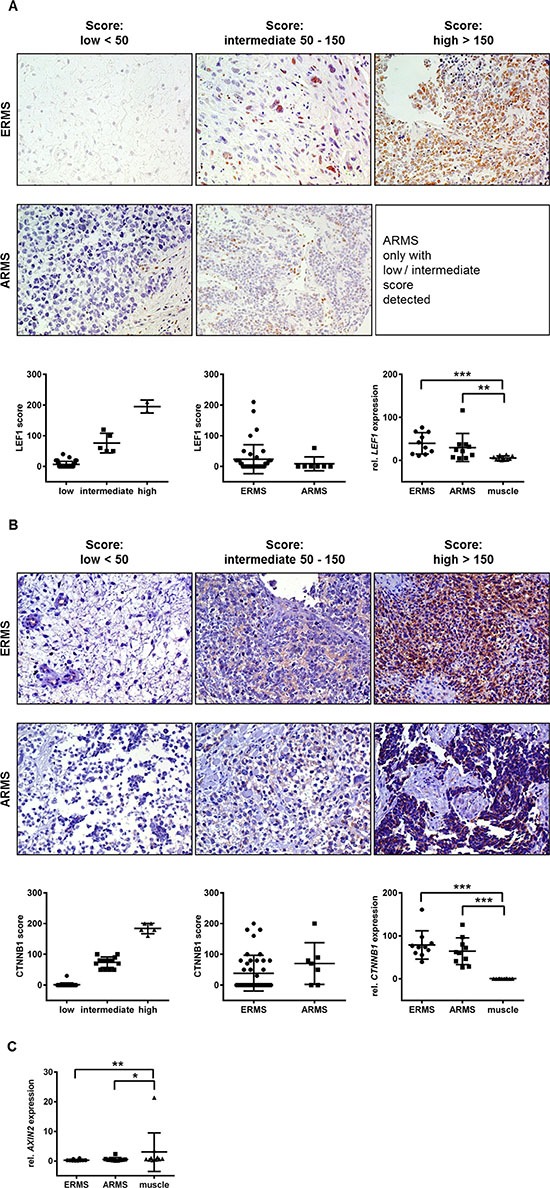
Figure 1. Immunohistochemical and/or qRT-PCR analyses of LEF1, β-catenin and AXIN2 in human ERMS and fusion-positive ARMS.

Representative data for LEF1 expression is shown in (A) and for β-catenin in (B). In each case upper panel shows immunohistochemistry stainings of the respective protein (LEF1 or β-catenin) in ERMS and fusion-positive ARMS. Results were scored by multiplying the percentage of positive cells by the intensity of the staining to subdivide studied samples into low, intermediate and high expressers. Lower left and center panels show the distribution of RMS in low, intermediate and high expressers according to the aforementioned scoring system and the distribution for ERMS and ARMS, respectively; right panels show LEF1 (or CTNNB1 in B) expression levels analyzed by qRT-PCR in fresh-frozen biopsies of human ERMS (n = 10) and fusion-positive ARMS (n = 10) compared to normal muscle (n = 10). (C) shows qRT-PCR analysis of AXIN2 in the same biopsies. (A, B and C) Bars, 95% confidence intervals and mean values; ***P < 0.001, **P < 0.01, *P < 0.05 by Mann-Whitney t-test.
