
Figure 2. Generation of stable LEF1 knockdown (LEF1 KD) RMS cell lines and expression analysis of WNT target genes.
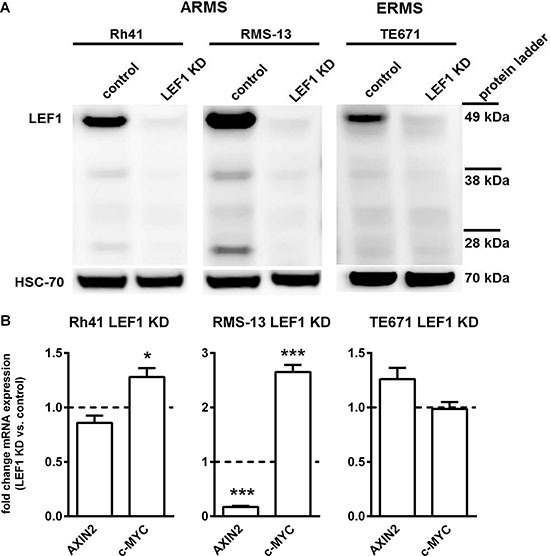
(A) Representative LEF1 Western blot of human ARMS cell lines Rh41 and RMS-13 and the human ERMS cell line TE671 stably expressing a LEF1 shRNA (LEF1 KD) or empty vector control (control). HSC-70 served as loading control. Protein ladder is shown for estimation of protein size. (B) Expression of AXIN2 and c-MYC in Rh41 LEF1 KD, RMS-13 LEF1 KD and TE671 LEF1 KD are shown as fold expression to the respective control cells that were set to 1 (dashed line). Gene expression levels were normalized to 18S rRNA expression levels. Data represent mean+SEM of at least three independent experiments performed in duplicates and measured in triplicates; *P < 0.05, ***P < 0.001 by Students t-test.