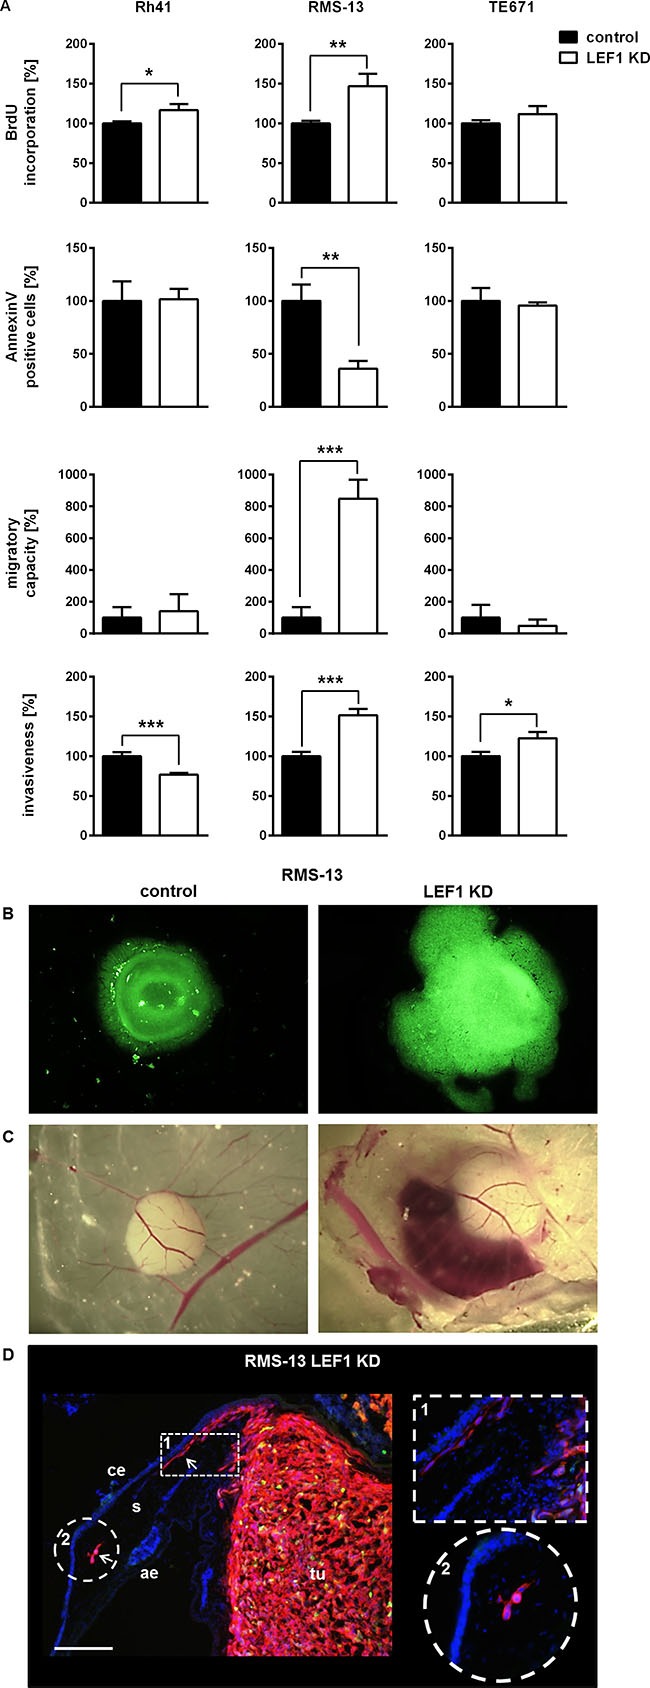
Figure 4. LEF1-dependent regulation of proliferation, apoptosis, migration and invasiveness of RMS cell lines.

(A) Proliferation, apoptosis, migratory capacity and invasiveness of the cells were analyzed by BrdU incorporation assay, FACS, trans-well migration and Boyden chamber assay, respectively. Data represent mean+SEM of at least two independent experiments performed in triplicates (BrdU incorporation assay, migration assay for RMS-13) or duplicates (apoptosis, migration and invasion assay). For all measurements the respective values from control cell lines were set to 100%. Comparisons were made with Students t-test; *P < 0.05, **P < 0.01, ***P < 0.001. (B and C) shows a representative intravital imaging of RMS-13 LEF1 KD and control cells in the CAM model at day 3 and 7 in each cohort post inoculation, respectively. (B) Due to stable transduction with lentiviral pGIPZ vector that expresses GFP the growth of the cells could be visualized by fluorescence (20-fold magnification). (C) RMS-13 LEF1 KD tumor growth is accompanied by destruction of vessels and hemorrhage (10-fold magnification). (D) Immunofluorescence staining of cryosection of tumors derived from RMS-13 LEF1 KD cells with anti-HLA-A,B,C (red) and DAPI (blue). White arrows mark tumor cells invading the stroma (s), and are also shown in the insets. Depicted are the chorion epithelium (ce), the allantoic epithelium (ae) and the tumor (tu). Scale bar 70 μm.
