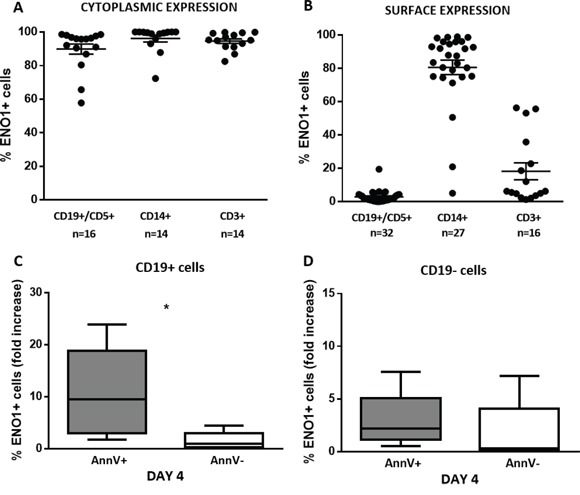
Figure 4. ENO1 is translocated on the surface of apoptotic CD19+ cells.

ENO1 expression was evaluated in PBMC isolated from patients with CLL, at baseline conditions and after 4-day in vitro culture by flow cytometry. A. ENO1 cytoplasmic expression. High percentages of ENO1 were expressed in the cytoplasm of CD19+/CD5+ CLL cells, CD14+ monocytes and CD3+ T cells. B. ENO1 surface expression. ENO1 was not expressed on the surface of CD19+/CD5+ CLL cells, whereas it was widely expressed by CD14+ monocytes and in a proportion of CD3+ lymphocytes. C, D. Surface ENO1 fold increase expression in CD19+ and CD19- cell fractions. Fold increase was calculated for each patient as a ratio between the percentage of CD19+/ENO1+ detected after 4-day in vitro culture and the percentage of CD19+/ENO1+ cells at baseline. After 4 days of culture, the fold increase in ENO1 expression was significantly higher in the apoptotic (AnnV+) than in the viable (AnnV-) fraction of CD19+ cells (p=0.02) (C). By contrast, there was no difference in the fold increase of ENO1 expression between the apoptotic (AnnV+) and the viable (AnnV-) fraction of CD19- cells (D). Box and whiskers plots represent median values, first and third quartiles, and minimum and maximum values for each dataset.
