
Figure 5. 1H-15N HSQC spectra of 15N Myc upon addition of 14N CaM (1:1).
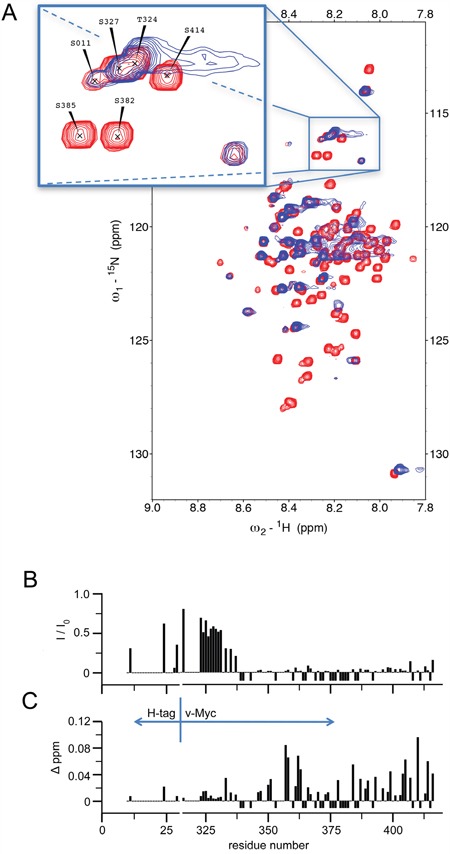
A. Overlay of HSQC spectra recorded with 15N Myc free in solution (red) and with equal amounts of Myc and CaM (blue). The zoomed inlet shows a section of the spectrum where peak overlap was relatively low. All measurements were carried out with an excess of Ca2+ over calmodulin. B. The intensity ratio between the free and CaM-bound form of 15N Myc peaks is plotted according to the residue position (I: peak intensity of 15N Myc with 14N calmodulin present, I0: peak intensity of 15N Myc free in solution). C. The change in the observed peak position upon addition of 14N CaM to 15N Myc is plotted according to the residue position. Given values correspond to a pseudo 1H shift (measured 1H shift + (1/5)*15N shift) in order not to bias towards mainly 15N shifting residues. Negative values in either plot indicate that the intensity of an assigned peak position went below noise level upon addition of CaM; positions not assigned or overlapping in the free form were not used and have 0-values. All measurements were carried out with excess Ca2+.