
Figure 1. Hierarchical clustering of samples on highly significantly differentially expressed CRGs.
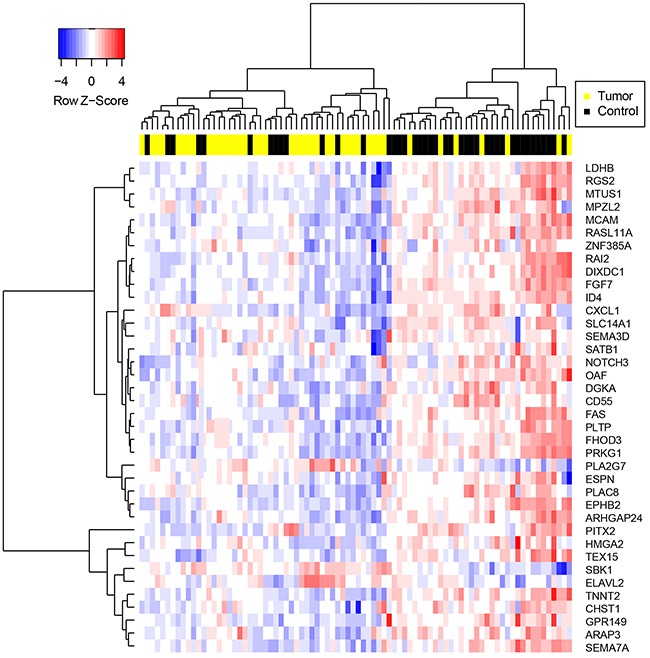
Genes were selected via two-tailed t-test between prostate cancer and benign tissue specimens with p-value < .01. Gene expression values were determined following normalization of qPCR data and imputation of missing values using the R package “nondetects”.