
Figure 4. ROC curves for predictions on validation set.
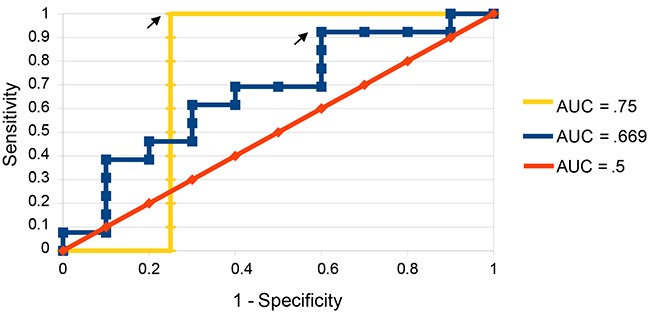
ROC curves were constructed both with all samples considered (blue) and with those best handled by surgical predictions removed compared to predictions made by chance (yellow). Arrows indicate the points at which recurrence score and non-recurrence score were given equal weight and predictions were made.