
Figure 5. Survival curves for predictions on validation set.
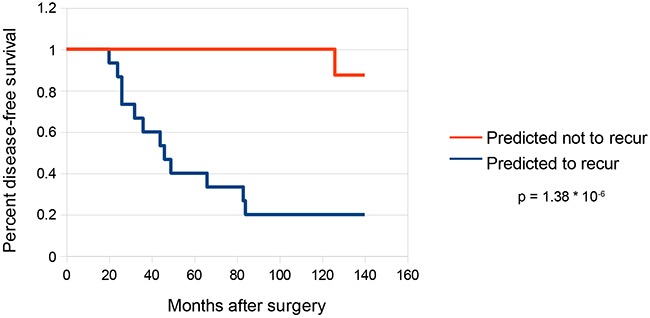
Kaplan-Meier survival curves were constructed for the subset of samples in the validation set that were predicted to recur (n = 15) as well as the subset of samples predicted not to recur (n = 8). Statistical analysis was performed by log-rank test using the R package “survdiff”.