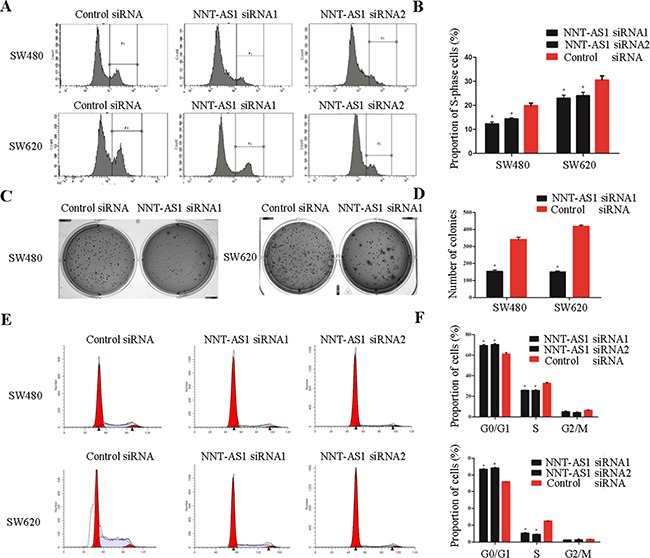
Figure 3. Function analysis of NNT-AS1 in vitro.

A. and B. Representative images of EdU assays in CRC cells. The percentage of proliferation cells is shown in the right panel (*P<0.01). C. and D. Representative images of colony assays and the number of colonies is shown in the right panel (*P<0.01). E. and F. Representative images of cell cycle assays and the percentage of each phase is shown in the right panel (*P<0.01). Date were presented as mean±SD.
