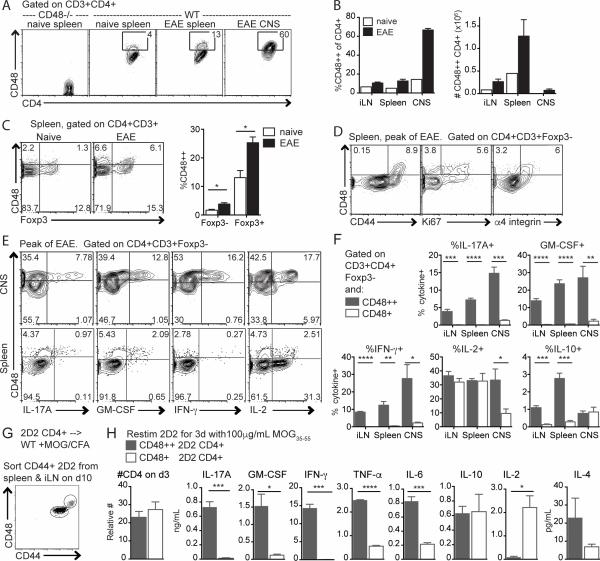
Figure 1. CD48 expression increases on activated CD4+ T cells during EAE.
A-F WT mice were immunized with MOG35-55/CFA to induce EAE. Spleen, LN and CNS (brain and spinal cord) were collected at the peak of disease, and analyzed by flow cytometry. WT or CD48−/− spleens from naïve mice were used as controls. A. CD48 expression on CD3+CD4+ cells from the spleen of naïve CD48−/− and WT mice, and spleen and CNS of WT mice with EAE. B. Percent (left) and number (right) of CD48++ of CD4+CD3+. C. Representative staining (left) and percentages (right) of CD48++ Foxp3− and Foxp3+ T cells in the spleen. D. CD48 co-expression with CD44, Ki67 and α4 integrin. E. Representative CD48 and intracellular cytokine expression in CD3+CD4+Foxp3- cells isolated from CNS and spleen at peak EAE and restimulated with PMA/ionomycin. F. Percentages of cytokine-producing cells among CD48++ and CD48+ cells, based on gates in E. G-H. WT Thy1.1 mice were given 2D2 Thy1.2+ CD4+ T cells i.v., immunized with MOG35-55/CFA, and 10 days later CD48++ and CD48+ 2D2 were purified by cell sorting. G. Representative gating for cell sorting. H. Number of CD4+ T cells (left) and cytokines in supernatants (right) after restimulation in vitro with MOG35-55 for 3 days. Representative of 3 independent experiments with 4-6 immunized mice and one naïve control (A-D), 3 independent experiments with 4-5 mice (E-F), and 4 independent experiments with 4-5 biological replicates (G-H).

