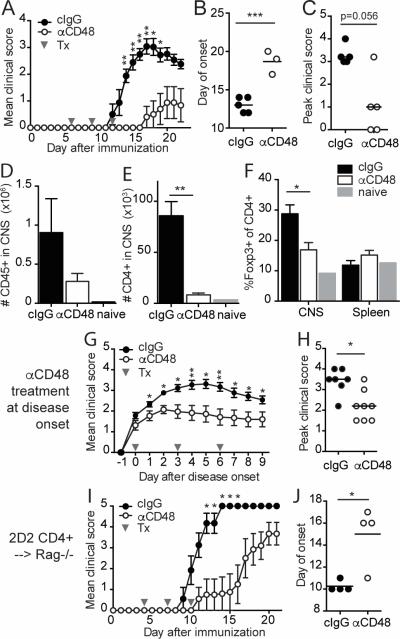
Figure 2. Anti-CD48 mAb attenuates MOG35-55-induced EAE.
A-F WT mice were immunized with MOG35-55/CFA, and treated with anti-CD48 or isotype control (cIgG) on days 6, 9 and 12 after immunization. A. Mean clinical scores, ±SEM. B. Day of EAE onset for mice that developed EAE. C. Peak clinical scores for all mice; bar represents median. D-F. CNS and spleen were collected for flow cytometric analysis at the peak of disease. Numbers of CD45+ cells (D) and CD3+CD4+ T cells (E) in the CNS. F. Percentages of Foxp3+ of CD4+CD3+ T cells in CNS and spleen. G-H. WT mice were immunized with MOG35-55/CFA, and anti-CD48 or cIgG treatment was started on the day of EAE onset in each mouse. G. Mean clinical scores, ±SEM, relative to day of disease onset. H. Peak clinical scores; bar represents median. I-J. 2D2 CD4+ T cells were purified by cell sorting and transferred into Rag1−/− mice. Recipients were immunized with MOG35-55/CFA, and given anti-CD48 or cIgG on days 4, 7 and 10. I. Mean clinical scores ±SEM. J. Day of EAE onset. Representative of 6 independent experiments with 4-6 mice per group (A-C), 3 independent experiments with 4-5 mice per group and one naïve control (D-F), 3 independent experiments with 4-8 mice per group (G-H), or 3 independent experiments with 4-6 mice per group (I-J). Gray arrows in A, G and I indicate antibody treatments (Tx). Dots in B, C, H and J represent individual mice.

