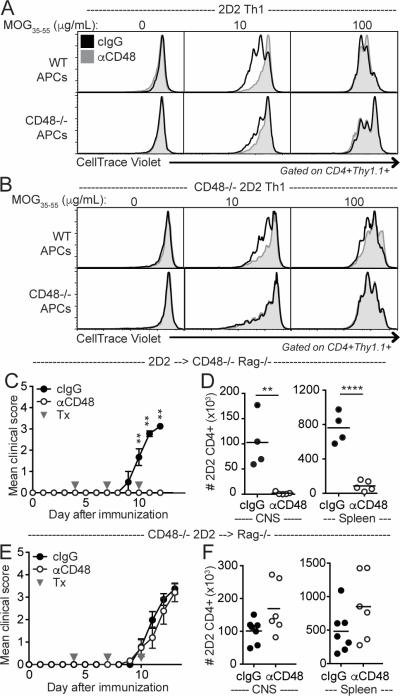
Figure 5. Anti-CD48 mAb limits proliferation and attenuates EAE through interactions with CD48 on distinct cell populations.
A-B. Representative CellTrace Violet dilution in Th1-polarized 2D2 (A) or CD48−/− 2D2 (B) CD4+ T cells restimulated in vitro with TCRα−/− (top rows) or CD48−/− TCRα−/− (bottom rows) splenocytes and MOG35-55 plus 10μg/mL cIgG or anti-CD48 for 3 days. C-F. 2D2 (C-D) or CD48−/− 2D2 (E-F) CD4+ T cells were purified by cell sorting and transferred to CD48−/− Rag−/− or Rag−/− recipients, respectively. Recipients were immunized with MOG35-55/CFA, and treated with anti-CD48 or cIgG on days 4, 7 and 10. C, E Mean clinical scores, ±SEM. E, F Number of 2D2 CD4+Thy1.1+ T cells in the CNS (left) and spleen (right). Representative of 5 independent experiments (A), 2 independent experiments (B), 4 independent experiments with 3-5 mice per group (C-D), 5 independent experiments with 4-6 mice per group (E-F). Gray arrows in C and E indicate antibody treatments (Tx). Dots in D and F represent individual mice.

