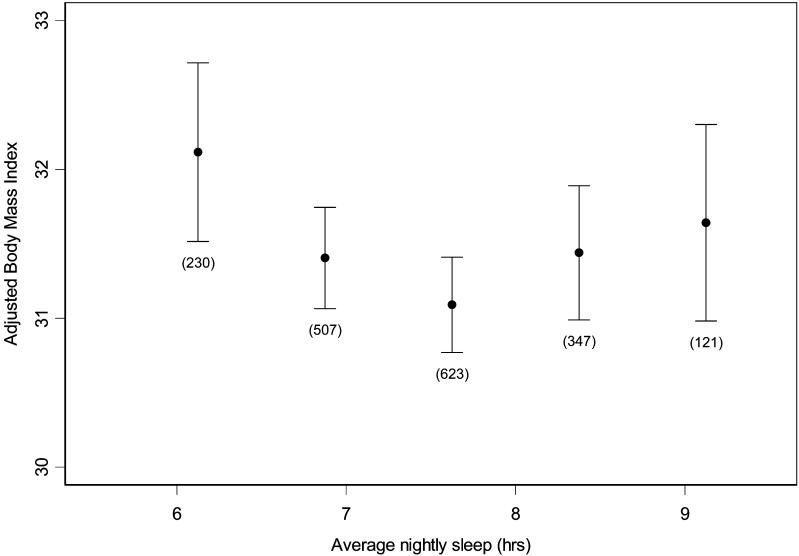
Figure 2. The Relationship between BMI and Average Nightly Sleep.
Mean BMI and standard errors for 45-min intervals of average nightly sleep after adjustment for age and sex. Average nightly sleep values predicting lowest mean BMI are represented by the central group. Average nightly sleep values outside the lowest and highest intervals are included in those categories. Number of visits is indicated below the standard error bars. Standard errors are adjusted for within-subject correlation.

